Lemmy Fans
  • Communities
  • Create Post
  • Create Community
  • heart
    Support Lemmy
  • search
    Search
  • Login
  • Sign Up
FundMECFS@lemmy.blahaj.zone to Data is Beautiful@mander.xyzEnglish ·
edit-2
3 months ago

Healthcare expenditure vs Life expectancy

lemmy.blahaj.zone

message-square
23
link
fedilink
250

Healthcare expenditure vs Life expectancy

lemmy.blahaj.zone

FundMECFS@lemmy.blahaj.zone to Data is Beautiful@mander.xyzEnglish ·
edit-2
3 months ago
message-square
23
link
fedilink
alert-triangle
You must log in or register to comment.
  • Kernal64@sh.itjust.works
    link
    fedilink
    English
    arrow-up
    55
    ·
    3 months ago

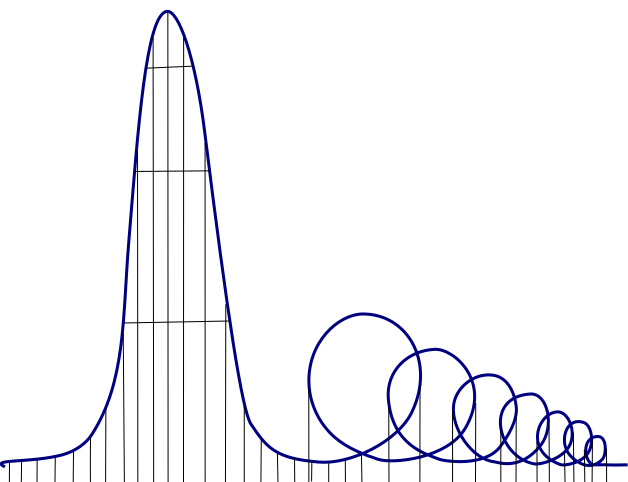
    I don’t think I’ve ever seen what appears to be a line graph loop back on itself.

    • jmcs@discuss.tchncs.de
      link
      fedilink
      English
      arrow-up
      21
      ·
      3 months ago

      Visualise it as a 3d graph seen from the top.

    • lnxtx (xe/xem/xyr)@feddit.nl
      link
      fedilink
      English
      arrow-up
      8
      arrow-down
      5
      ·
      3 months ago

      Math people are cringing.

      • naeap@sopuli.xyz
        link
        fedilink
        English
        arrow-up
        23
        ·
        edit-2
        3 months ago

        But in this graph it’s correct, isn’t it?

        A bit of a strange choice of axis, but technically it’s correct, I think.
        We see how during COVID people died earlier although expenses went up (didn’t check the dates, but I guess that’s the thing?), and afterwards expenses went down, but people grow older again
        Or do I completely misunderstand this?

        • Farid@startrek.website
          link
          fedilink
          English
          arrow-up
          9
          ·
          3 months ago

          Yeah, it’s correct. What they did is, for every year they place a dot with respect to x and y axis, then connected the dots. An unusual graph, but works well for this situation, IMO.

      • angrystego@lemmy.world
        link
        fedilink
        English
        arrow-up
        15
        ·
        3 months ago

        I don’t think they’re cringing, this is perfectly correct.

        • lnxtx (xe/xem/xyr)@feddit.nl
          link
          fedilink
          English
          arrow-up
          1
          arrow-down
          2
          ·
          3 months ago

          By the definition:

          A function f from a set X to a set Y is an assignment of one element of Y to each element of X.

          /s

          • InfiniteFlow@lemmy.world
            link
            fedilink
            English
            arrow-up
            14
            ·
            3 months ago

            This is not a function graph, though. It is a Connected Scatterplot.

      • Strawberry@lemmy.blahaj.zone
        link
        fedilink
        English
        arrow-up
        6
        ·
        3 months ago

        I have a degree in math and I’m not cringing

  • julianwgs@discuss.tchncs.de
    link
    fedilink
    English
    arrow-up
    21
    arrow-down
    1
    ·
    3 months ago

    Can we please always link to the original data?

    • satanmat@lemmy.world
      link
      fedilink
      English
      arrow-up
      13
      ·
      3 months ago

      FWIW. Here’s the wiki link

      https://en.m.wikipedia.org/wiki/List_of_countries_by_total_health_expenditure_per_capita

  • will_a113@lemmy.ml
    link
    fedilink
    English
    arrow-up
    11
    ·
    3 months ago

    Can you guess when HMOs became a thing (and Blue Cross converted from not-for-profit to for-profit)?

    • Balthazar@lemmy.world
      link
      fedilink
      English
      arrow-up
      4
      ·
      3 months ago

      1981?

      • will_a113@lemmy.ml
        link
        fedilink
        English
        arrow-up
        10
        ·
        3 months ago

        I was asking rhetorically since the graph makes it pretty obvious, but actually re-reading this article it’s a bit more complex than I recalled. There was basically some legislation in the mid 1970s that made them possible, the model grew through the 80s, but by the late 80s low-rent HMOs had taken over, and a crippling combo of regulation (to create new barriers to entry) and deregulation (for the existing guys) basically cemented the for-profit HMO/PPO providers that we all know and love (haha) by the 1990s. Had we held out for another decade we probably would have seen socialized medicine by the Clinton-era, but instead we got this graph, where we pay more and get less than everyone else, and half the country thinks it’s a great idea.

  • nonentity@sh.itjust.works
    link
    fedilink
    English
    arrow-up
    8
    ·
    3 months ago

    The US is on track to implementing the Euthanasia Coaster.

  • a14o@feddit.org
    link
    fedilink
    English
    arrow-up
    7
    ·
    3 months ago

    INTERNATIONAL DOLLAR (PPP)

    COUNTRY MONEY (GDP)

  • acockworkorange@mander.xyz
    link
    fedilink
    English
    arrow-up
    3
    ·
    3 months ago

    What is Chile doing?

    • Farid@startrek.website
      link
      fedilink
      English
      arrow-up
      5
      ·
      3 months ago

      Just Chileing?

      • Evil_Shrubbery@lemm.ee
        link
        fedilink
        English
        arrow-up
        1
        arrow-down
        1
        ·
        3 months ago

        Too chilly hot to chilly chill.

  • AllNewTypeFace@leminal.space
    link
    fedilink
    English
    arrow-up
    3
    ·
    3 months ago

    Not to worry, it’ll soon dip back down as the Almighty, who is also the Invisible Hand Of The Free Market, wills

  • Evil_Shrubbery@lemm.ee
    link
    fedilink
    English
    arrow-up
    4
    arrow-down
    1
    ·
    3 months ago

    Whoa, wtf is Polandball doing?
    I didn’t know such differences still existed (not counting USA ofc).

    • CitizenKong@lemmy.world
      link
      fedilink
      English
      arrow-up
      5
      ·
      3 months ago

      Poland has the worst air pollution in the whole of Europe. For one, they still have a lot of coal plants but even more importantly, a lot of homes have never been modernized and still heat with coal too. On top of that, many cars are also old and dirty.

  • Atlas_@lemmy.world
    link
    fedilink
    English
    arrow-up
    3
    ·
    3 months ago

    Australia is definitely not counting deaths due to drop bears

Data is Beautiful@mander.xyz

dataisbeautiful@mander.xyz

Subscribe from Remote Instance

Create a post
You are not logged in. However you can subscribe from another Fediverse account, for example Lemmy or Mastodon. To do this, paste the following into the search field of your instance: [email protected]

Be respectful

Visibility: Public
globe

This community can be federated to other instances and be posted/commented in by their users.

  • 1 user / day
  • 32 users / week
  • 1.75K users / month
  • 3.25K users / 6 months
  • 1 local subscriber
  • 1.87K subscribers
  • 88 Posts
  • 634 Comments
  • Modlog
  • mods:
  • KnowledgeIsPower@mander.xyz
  • WanderingPhoenix@mander.xyz
  • BE: 0.19.11
  • Modlog
  • Instances
  • Docs
  • Code
  • join-lemmy.org