
You must log in or register to comment.
This makes my eyes bleed
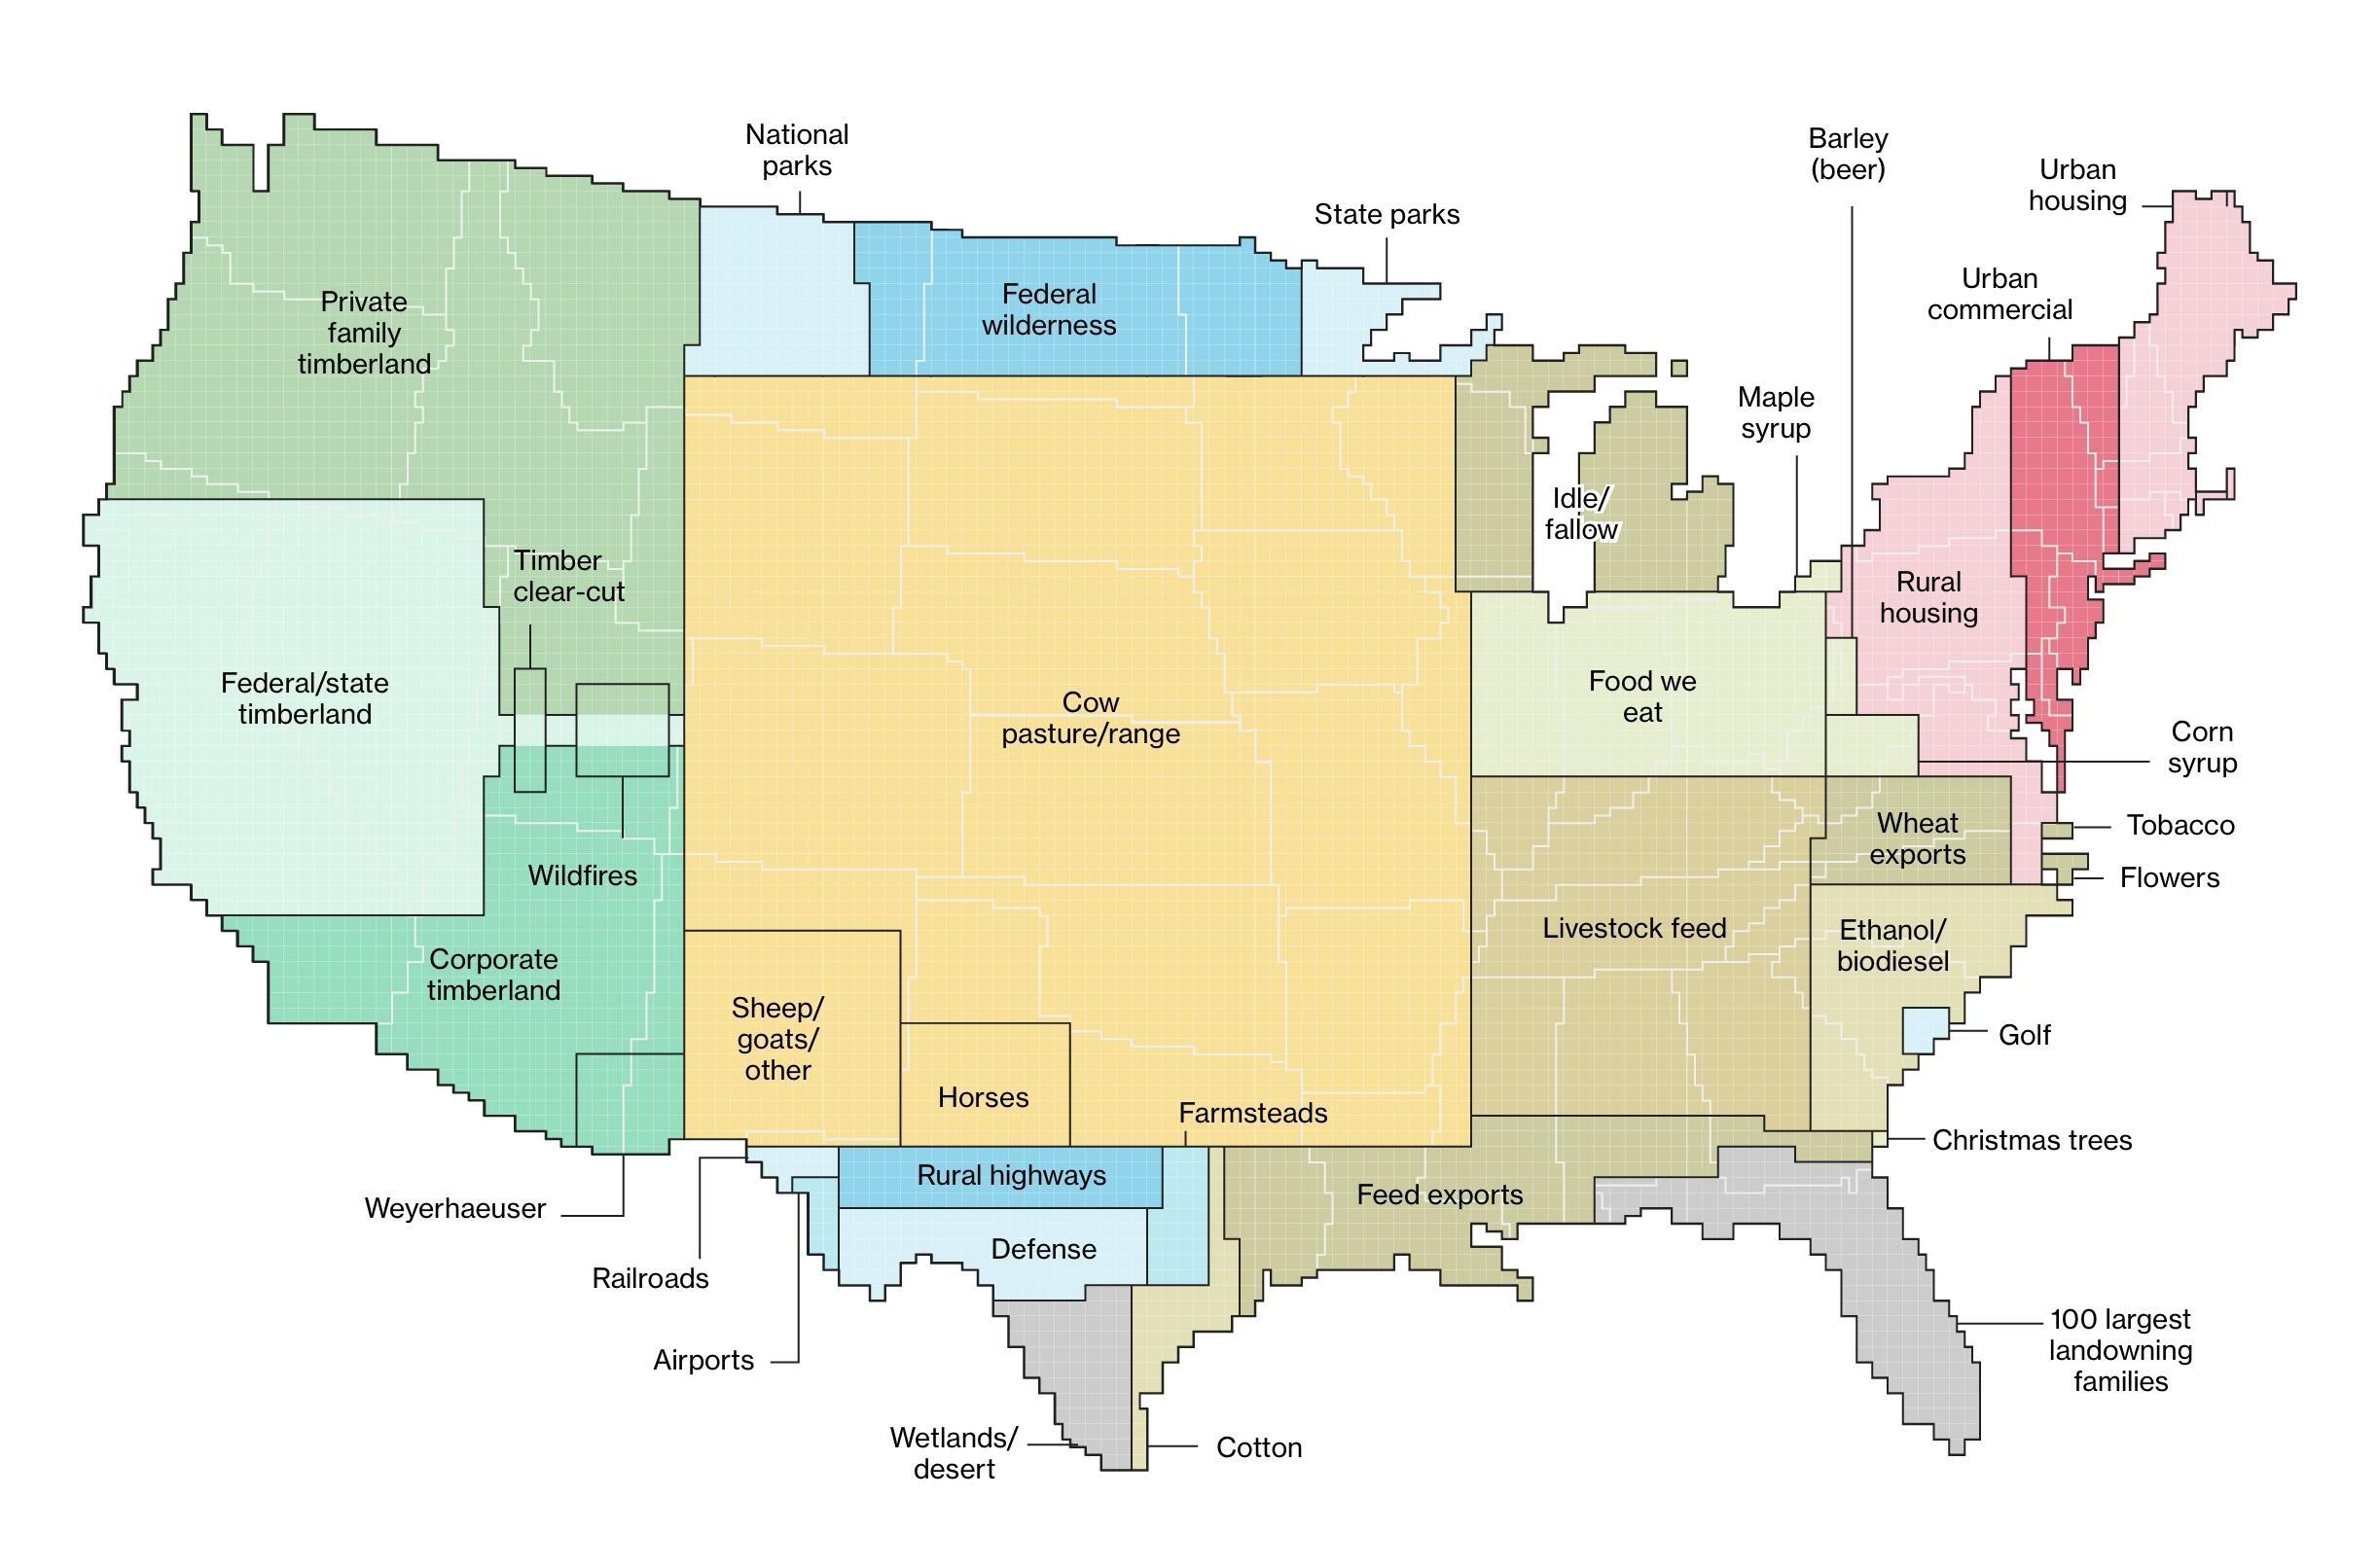
Can’t figure out why the 100 largest landowning families aren’t using their land for any of the other reasons. Surely some of them are having it farmed for them too?
Swamps don’t make good farms, but some people try to farm in FL, it’s just inefficient and heavily pollutes or eliminates wetlands
OIL. There’s a LOT of land that might be considered cow/grazing but won’t really grow anything worth it. See West Texas.
“Wildfires” is a surprisingly large area. I wonder what the 2025 area for it is.
Do we not eat any of the cows?
Vegans and ecologists have been talking about this exact issue for a while now
literally decades. lots of talk around the conditions that bring new pandemics too.
if its alafalfa, i think alot of farm land are, its usually exported to the Middle east.
It simply takes a loooot of food to produce 1kg of beef
I expect a substantial portion of that cow pasture/range land is dry grasslands and shrub steppe out west. It’s rough terrain and not good for much else. A lot of it doesn’t even have cows on it most of the time.
Golf is way too big, imo. No other sport even makes the list here.
Maybe we can combine it with “wildfires”.
So nice of the 100 largest land owning families to have the same amount of land as the entire urban or rural housing population of the rest of the country. I assume it’s to fatten themselves up for the rest of us just like the cows.
When do we get to eat them again?
Shit I’m hungry now I’ll start the smoker
Fuck golf
Ban golf and replace all courses with public housing
Yeah that land could be used for more christmas trees
Gotta see one of these with parking.
It would be a subset of “urban commercial”, right? Somewhere in the range of half to three-quarters of it?
Depends how these are defined. Public parking or on-street parking are likely in a different category, not to mention people’s driveways.
Yeah Maine is so well known for it’s urban housing
And Nevada for its timberland.
This graph is confusing because there are state lines drawn underneath, but it’s not saying by state.
God I miss living in the west.
It’s quite interesting that “rural highways” is one of the categories identified, but not any other sort of improved road. The data source has a base granularity where one square is 250,000 acres (~100,000 hectares), and then additional state data is factored in for increased precision. It supposingly being USDA data, they might primarily care only about those highways used to connect farms to the national markets.
That said, I would be keenly interested in the land used for low-volume, residential streets that support suburban and rural sprawl, in comparison to streets in urban areas. Unlike highways which provides fast connectivity, and unlike dense urban-core streets that produce value by hosting local businesses and serving local residents, suburban streets take up space, intentional break connectivity (ie cul de sacs), return very little in value to anyone except to the adjacent homeowners, essentially as extensions of their privately-owned driveways.
It may very well be in USDA’s interest to collect data on suburban sprawl, as much of the land taken for such developments was perfectly good, arable land.
I love this visualization and for some reason your comment made me also wish we had this data correlated with the water usage for each land use category.
There’d be a square or two which just say “Nestlé” lol
It seems a little inefficient to put all the airports together
Its really not so bad once you get over the 12 hour drive.
and somebody owns every square inch of it.
I think the graphic would be better if some of the data were nested by size and relationship. IOW Agricultural land would have grazing, food production, feed production, etc. in decreasing size nested over an area. Might give greater sense of how much land is used for ag. Same for forestry; Forestry, parks, commercial logging, etc.


